Run pipeline
Verify input files
If you followed along, you should see a pretty clean project directory (you may also have a couple of .toml files):
PS C:\Users\f\BitmapMaps> tree /F Stetind
Folder PATH listing
Volume serial number is 6E6D-2993
C:\USERS\F\BITMAPMAPS\STETIND
    BitmapMaps.ini
    eksport_1150771_20250401.zip

No subfolders exist
If you solve crosswords with a pen, go ahead and run_pipeline()! The .zip file will be read. But in Windows, unzipping large files programmatically might irritate the anti-virus ghosts.
Unzipping the .tif files manually is good practice [1]. Just unzip and place the large .tif files in '~/BitmapMaps/Stetind'! Metadata files and all folders can be deleted, along with the .zip file. We should now have:
C:\USERS\F\BITMAPMAPS\STETIND
    BitmapMaps.ini
    dtm1_33_143_175.tif
    dtm1_33_143_176.tif
    dtm1_33_144_175.tif
    dtm1_33_144_176.tif
The .tif files are 32-bit image files, i.e. gray scale with potentially four billion shades. You could edit these images in GIMP with large difficulty [2].
Run the pipeline
Ready with the Julia prompt?
using BitmapMaps
# Request more detailed feedback. With one sheet, it's not too much.
ENV["JULIA_DEBUG"] = "BitmapMaps"
# This defines a SheetMatrixBuilder like we did before, then does the work
run_bitmapmap_pipeline();
...which produces all of this feedback:
[ Info: Default settings read from C:\Users\f\BitmapMaps\Stetind\BitmapMaps.ini
Bitmapmap builder based on .ini file and keywords
SheetMatrixBuilder((564923, 7560194), # southwest_corner
      CartesianIndices((1:1, 1:1)), # sheet_indices
                                 1, # cell_to_utm_factor
                               191, # sheet_width_mm
                               275, # sheet_height_mm
                             11811, # density_pt_m⁻¹
              "BitmapMaps/Stetind") # pth
        [easting, northing] derived properties:
          Bounding Box (BB) SE-NW            = (564923 7560195)-(567177 7563442)
          Northeast internal corner          = (567177, 7563442) - most northeastern sample point
          Geo centre                         = (566050.5, 7.561818e6)
          Grid centre single                 = (566050, 7561818)
        Derived properties:
          Geographical (width, height) [km]  = (2.3, 3.2)
          Geographical area [km²]            = 7
                    Per sheet = 7.32 km²   (Single file export limit: 16 km²)
          Sheets total (width, height) [cm]  = (19.1, 27.5)
                    Per sheet [mm] (w, h) = (190.9, 275.0)
          Map scale                          = 1 : 11811 = 1 : (cell_to_utm_factor * density_pt_m⁻¹)
        BBs of sheets as Well Known Text (paste in wktmap.com or nvdb-vegdata.github.io/nvdb-visrute/STM ):
          MULTIPOLYGON (
                   ((564923 7560194, 567178 7560194, 567178 7563442, 564923 7563442, 564923 7560194)))
[ Info: Mosaic of linked sheets thumbnails in C:\Users\f\BitmapMaps/Stetind\(564923 7560195)-(567177 7563442).svg
┌ Debug: Pre-process: Make C:\Users\f\BitmapMaps/Stetind\(564923 7560195)-(567177 7563442).svg
└ @ BitmapMaps C:\Users\f\.julia\packages\BitmapMaps\ZBwH9\src\vector_graphics.jl:341
┌ Debug:     Common to all sheets, graph file: ffna_graph = raw"C:\Users\f\BitmapMaps/Stetind\(564923 7560195)-(567177 7563442).z"
└ @ BitmapMaps C:\Users\f\.julia\packages\BitmapMaps\ZBwH9\src\pipeline.jl:152
[ Info: Sheet [1, 1] of up to [1, 1], at 18:45:21
┌ Debug:  1 `establish_folder` at 18:45:21. C:\Users\f\BitmapMaps/Stetind\1-1__564923-7560194__567178-7563442
└ @ BitmapMaps C:\Users\f\.julia\packages\BitmapMaps\ZBwH9\src\pipeline.jl:203
┌ Debug:  2 `unzip_tif` at 18:45:22. C:\Users\f\BitmapMaps/Stetind\1-1__564923-7560194__567178-7563442
└ @ BitmapMaps C:\Users\f\.julia\packages\BitmapMaps\ZBwH9\src\pipeline.jl:203
┌ Debug:  3 `consolidate_elevation_data` at 18:45:24. C:\Users\f\BitmapMaps/Stetind\1-1__564923-7560194__567178-7563442
└ @ BitmapMaps C:\Users\f\.julia\packages\BitmapMaps\ZBwH9\src\pipeline.jl:203
┌ Debug:     Find nonzero bounding box from C:\Users\f\BitmapMaps\Stetind\dtm1_33_143_175.tif
└ @ BitmapMaps C:\Users\f\.julia\packages\BitmapMaps\ZBwH9\src\consolidate_elevation_data.jl:164
┌ Debug:     Find nonzero bounding box from C:\Users\f\BitmapMaps\Stetind\dtm1_33_143_176.tif
└ @ BitmapMaps C:\Users\f\.julia\packages\BitmapMaps\ZBwH9\src\consolidate_elevation_data.jl:164
┌ Debug:     Find nonzero bounding box from C:\Users\f\BitmapMaps\Stetind\dtm1_33_144_175.tif
└ @ BitmapMaps C:\Users\f\.julia\packages\BitmapMaps\ZBwH9\src\consolidate_elevation_data.jl:164
┌ Debug:     Find nonzero bounding box from C:\Users\f\BitmapMaps\Stetind\dtm1_33_144_176.tif
└ @ BitmapMaps C:\Users\f\.julia\packages\BitmapMaps\ZBwH9\src\consolidate_elevation_data.jl:164
┌ Debug:     Copy cells from C:\Users\f\BitmapMaps\Stetind\dtm1_33_144_175.tif
└ @ BitmapMaps C:\Users\f\.julia\packages\BitmapMaps\ZBwH9\src\consolidate_elevation_data.jl:108
┌ Debug:  4 `water_overlay` at 18:45:44. C:\Users\f\BitmapMaps/Stetind\1-1__564923-7560194__567178-7563442
└ @ BitmapMaps C:\Users\f\.julia\packages\BitmapMaps\ZBwH9\src\pipeline.jl:203
(..snip..)
┌ Debug: 14 `join_layers` at 18:47:16. C:\Users\f\BitmapMaps/Stetind\1-1__564923-7560194__567178-7563442
└ @ BitmapMaps C:\Users\f\.julia\packages\BitmapMaps\ZBwH9\src\pipeline.jl:203
┌ Debug:     Saving C:\Users\f\BitmapMaps/Stetind\1-1__564923-7560194__567178-7563442\Composite.png
└ @ BitmapMaps C:\Users\f\.julia\packages\BitmapMaps\ZBwH9\src\layers.jl:63
Finished job in folder C:\Users\f\BitmapMaps/Stetind
                                                        \1-1__564923-7560194__567178-7563442
Result files
None of the work files were deleted. You could modify any intermediate results and rerun the pipeline. The 'modified' timestamps would be recognized and incorporated into the steps after it. These are the files:
PS C:\Users\f\BitmapMaps> tree /F Stetind
Folder PATH listing
Volume serial number is 6E6D-2993
C:\USERS\F\BITMAPMAPS\STETIND
│   (564923 7560195)-(567177 7563442).css
│   (564923 7560195)-(567177 7563442).csv
│   (564923 7560195)-(567177 7563442).svg
│   (564923 7560195)-(567177 7563442).z
│   BitmapMaps.ini
│   dtm1_33_143_175.tif
│   dtm1_33_143_176.tif
│   dtm1_33_144_175.tif
│   dtm1_33_144_176.tif
│   tifdic.jls
│
└───1-1__564923-7560194__567178-7563442
        (564923 7560195)-(567177 7563442).z
        Composite.css
        Composite.png
        Composite.svg
        Consolidated.tif
        Contour.png
        Grid.png
        Markers.png
        Parse_builder.jl
        Ridge.png
        Summits.csv
        Thumbnail.png
        Toporelief.png
        Water.csv
        Water.png
'(564923 7560195)-(567177 7563442).svg'
is a mosaic referring all [3] the file(s) called 'Thumbnail.png'. The numbers are UTM coordinates for the (SW)-(NE) corners. In this case there's just one sheet and one thumbnail, so the sheet corners are identical to those of the whole map.
The mosaic file '(SW)-(NE).svg' is intended for local inspection. Open it in a browser, then click to open the detailed 'Composite.svg' for a sheet. An .svg image can be zoomed to 500% in most browsers, which is not enough for detailed inspection. For setting up zoom / pan, see footnote [4].
'Consolidated.tif' is the elevation data from the dowloaded .tif files needed for this map. We know it contains no NaN or 'missing' values, and so it is much faster to access.
'Thumbnail.png' looks like this (we'll come back to improvements later):
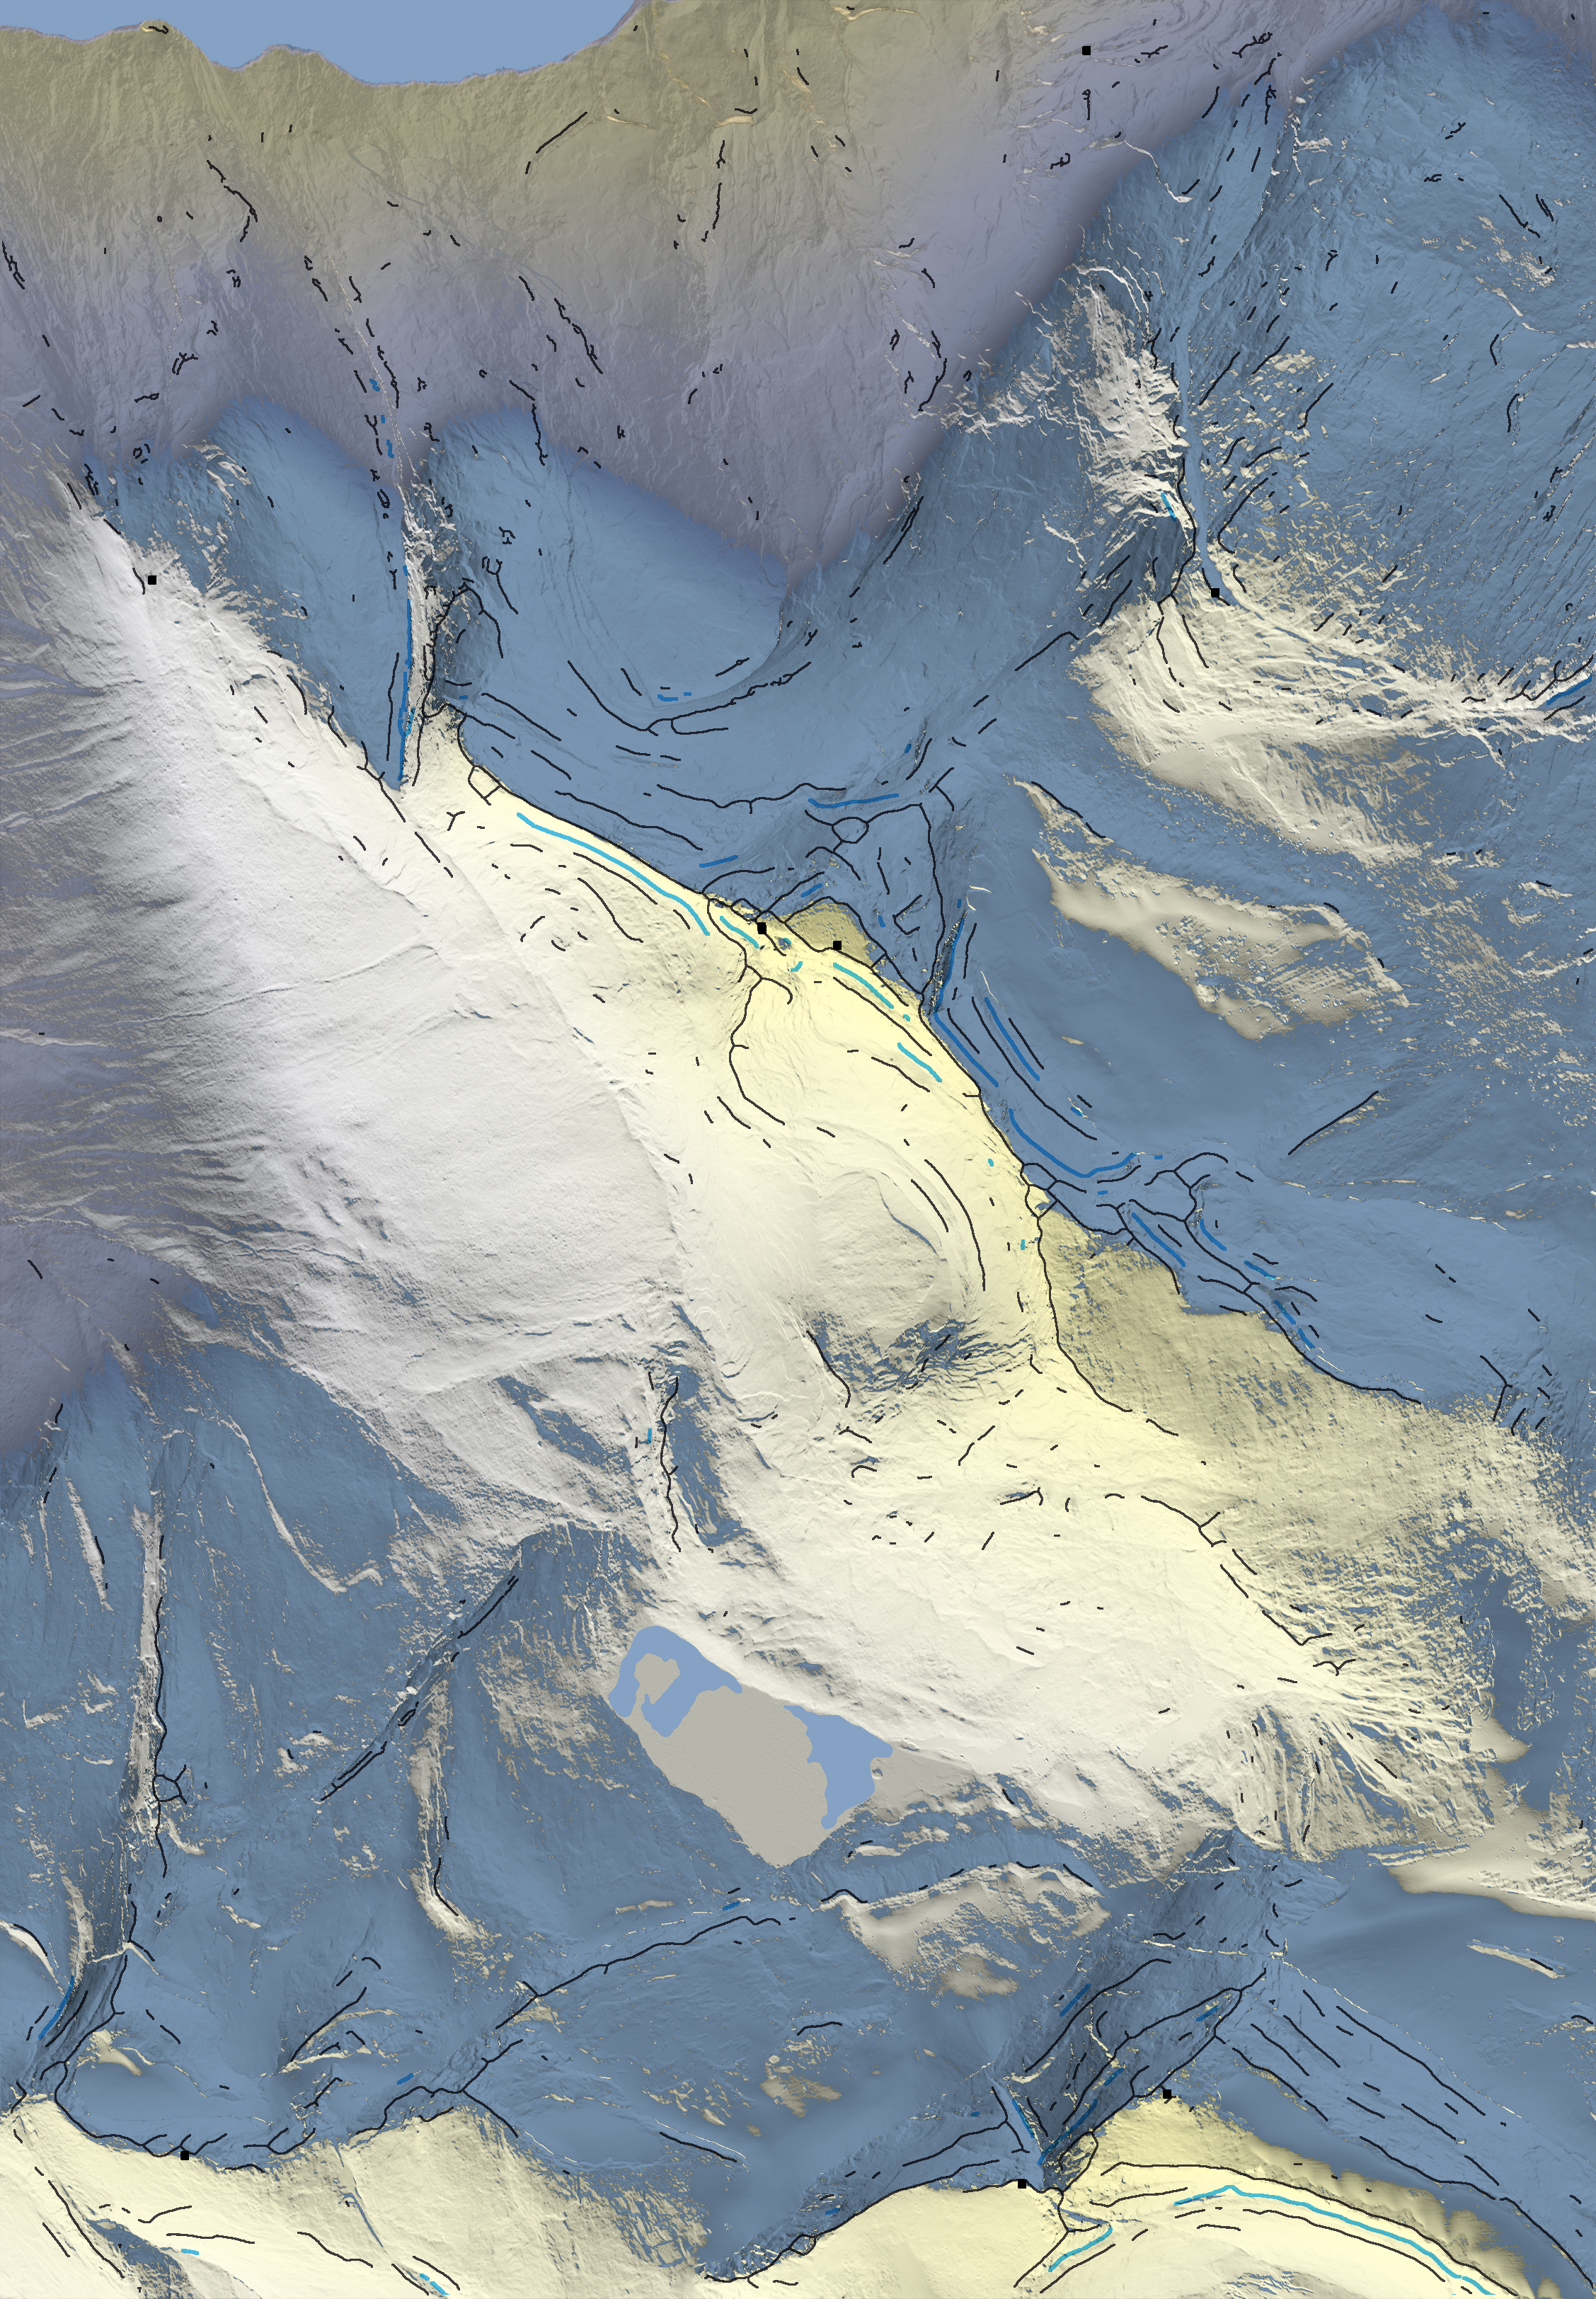
'Composite.svg', when opened in a browser, will also load 'Composite.css' and 'Composite.png'. Without fancy pan and zoom [4], it looks like this:
'Composite.css' defines the fonts for text.
'Composite.png' is a layered image. 'Toporelief.png' is the bottom layer, the transparent 'Grid', 'Markers', 'Ridge', 'Water' and 'Contour' are placed over it.
'Summits.csv' and 'Water.csv' are editable text files. Editing the former is the easiest way to manually fix summit names or add other labels.
'tifdic.jls' is a non-editable library of the geotiff files.
'(SW)-(NE).z' is a non-editable data structure for summit prominence calculation.
'Parse_builder.jl' is a backup of the settings used to create the folder.
Evaluating the first run
So, this was the default try, and it can easily be improved:
Problem: The lake at 727 m above sea level is not properly recognized as one single lake.
Solution: Perhaps there was un-even ice when the LIDAR measurements were made. A little smoothing of the lake withedit_in_gimp(smb[1,1], 726f0, 728f0)would fix that[2].Problem: Just one of the four summits were identified by name.
Solution: That's not typical, but Stetinden is famous for its entirely flat top. That's why the name location is farther from the summit than 150 m. Other names don't exist in the online name data base, which we hope is not typical in Lule-Sami regions. You can dive into?BitmapMaps.point_names, or simply edit 'Summits.csv' in a text editor before re-running the pipeline.Problem: The 1x1 km UTM grid just doesn't look right.
Solution: If printed, the map scale is 1 : 11811, typical for orienteering maps rather than mountaineering. Also, the grid is fully aligned with the sheet, because the local UTM zone happens to be the standard UTM zone for this country (which is the projection). Either modify 'BitmapMaps.ini', delete 'Grid.png' and rerun, or manually edit 'Grid.png' and rerun.Problem: Stetinden, at 1391 m above sea level, is shown to have a sumit prominence of 1391 m. It should be roughly 604 m down to a saddle towards Isfjellet (1437 m) at UTM 33 W 579143 7559091.
Solution: You would have to either a) define a map with both mountains and potential saddles (cols) to get that right. They would not need to be on the same sheet, though. Or b) edit 'Summits.csv'.Problem: Halls fortopp, at 1314 m, is not shown.
Solution: The saddle between Halls and the taller Stetind seems to be at 1265 m, so Hall's prominence is probably 49 m. Adjust the 'Obscure summit' value in BitmapMaps.ini from 50 m to e.g. 45 m, and more summits will be identified.Problem: The summit at 940 m is in sunlight, while it should clearly be in the shadow of the main summit.
Solution: This is the case for similar map styles, and while unrealistic, makes reading the map easier.Problem: There is snow everywhere.
Solution: I think that more zoomed-out maps are more visually pleasing without sharp details like details, and so snow is everywhere above the snow limit. This zoomed-in map looks better with snow falling off cliff faces. This is a little more difficult, so we'll do it in a couple of pages.
Problem: The light direction, from SSW, is not visually pleasing.
Solution: Yes, the light comes directly onto the South-West face oof Stetind, washing out a lot of detail. The default settings may not be the best for this map. Light direction is hard-coded, so customized functions are needed.We'll look at changing light direction on the next page.
| [1] | BitmapMaps will make an internal library of .tif files and their actual content after opening each file once. The library is stored as 'tifdic.jls'. |
| [2] | Gimp could open a geotiff file directly, and can save it without destroying the metadata which makes these files more than image files. However, it only displays 256 shades of grey at a time - the rest will be "darker than black, whiter than white". See inline docs ?edit_in_gimp and heed the warnings, or you may easily mess up the tiny variations in smoothness and curvature which BitmapMaps uses to identify various surface types. |
| [3] | Most often, a map will have multiple sheets, each with its own folder. In this example, we use only one. There is no hard limit on how many pixels you could fit on a sheet, but some of the calculations we do will take impractically long to finish when there is too much information on one sheet. When divided properly, wall- or book-sized printed maps are unproblematic. |
| [4] | 1] Copy the template from ~/.julia/packages/BitmapMaps/–-/resource/index.html to ~/BitmapMaps/Stetind/index.html 2] Open .html file in a text editor, change the 'defaultSvgFile' value to point to your .svg file. 3] Start a local server in that directory from Julia, e.g. using LiveServer. Note that the .html page uses Timmy Willison's 'Panzoom.js', which will download automatically. |